Standard Classification Metrics and Curves
On this page, let's have a look at some of the more widely used metrics to test the performance of a binary classifier. For a binary classifier, the model can go wrong in one of two ways. Either it can classify a positive class as negative (false negative), or it can classify a negative class as positive (false positive).
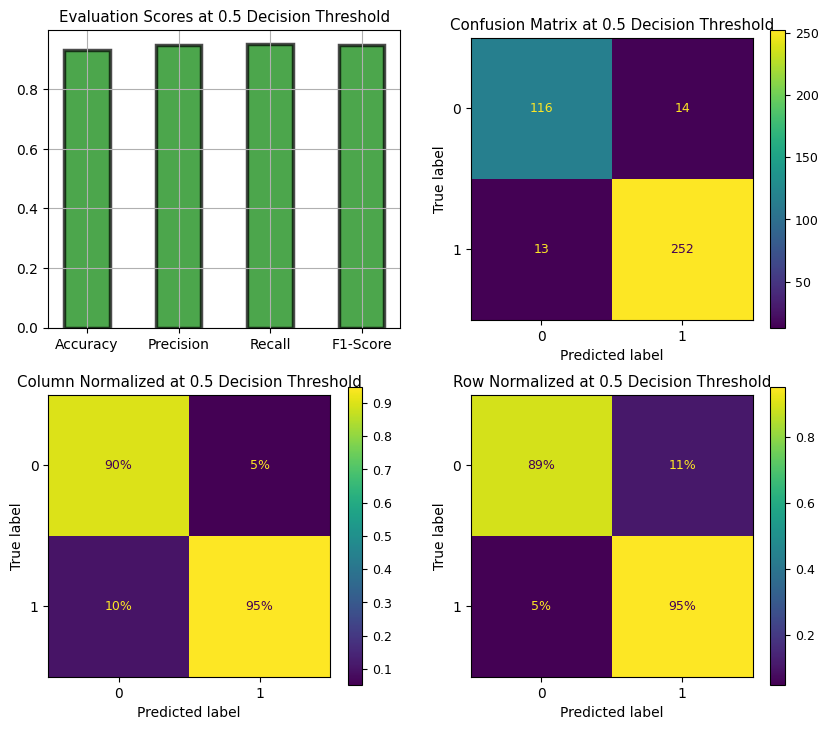
Once a model classifies all examples, let's say on our hold out test set, we calculate metrics such as accuracy, precision, recall (true positive rate or TPR), false positive rate or FPR, f1-score and others. The equations for these metrics are given below.
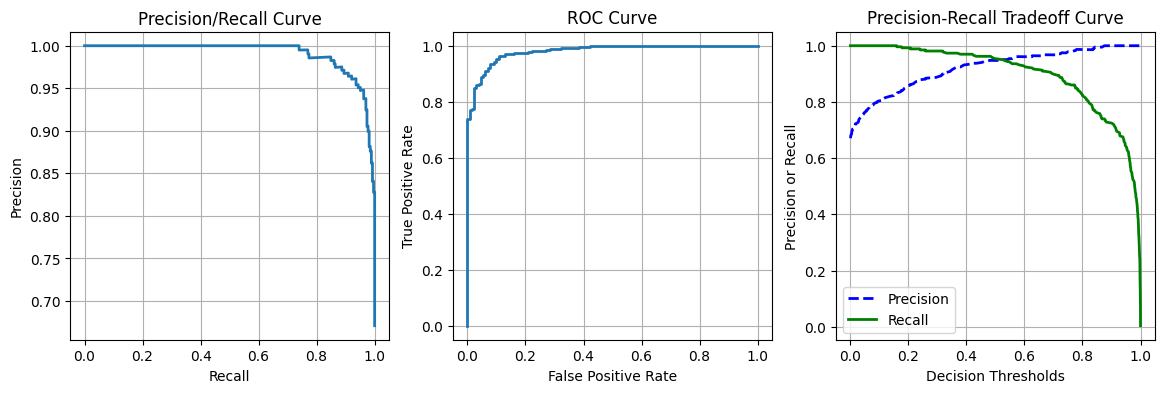
We can plot curves of precision against recall and TPR against FPR to gain more clarity on these metrics because there is an inherent tradeoff among them. For our model, we plot graphs of these metrics below. The decision threshold in this example is set to 0.5, meaning if the model's prediction is above 0.5, the model classifies the sample as positive and if the prediction is below 0.5, as negative.

